Have you ever thought about bringing cold, hard statistics to one of life's greatest artistic joys? Well fear not, because in our increasingly data-driven world, our analyst friends are hard at work attempting to statistisize (numerize?) everything you can think of, so we can analyze and therefore optimize it. One of the art realms that is increasingly falling under the purview of data science is music. We all benefit from it in the form of curated daily Spotify playlists and Pandora stations that allow us to find new artists and songs.

As suspected, current active artists (DaBaby, Lil Uzi Vert, etc.) enjoy higher popularity than names like A Tribe Called Quest (ATCQ) or Biggie Smalls.

I threw Lil Peep in there for fun and as a litmus for how good the measure is -- for those of you who don't know Lil Peep was a famous "Emo Rapper," a genre of music known for being, well... emo. Some surprises -- Eminem's music was actually graded as somewhat positive? That's a surprise for anyone who paid attention to his national infamy during his height - or maybe this is just proof the media was making something out of nothing. Or maybe his body of work since he got sober is bringing the average up. The rest of the results make sense -- the artists portrayed aren't the happiest bunch, so it makes sense that the bulk of them skew towards the more "negative" end of the positivity metric.

I was recently able to get my hands on a Spotify dataset that contains data on over 160k tracks dating from 1921 through December 2020. Aside from containing some basic features like track name, duration, and release date, it also contains some advanced metrics as calculated by Spotify like "track positivity" (is it a sad, depressed song, or a happy, positive song?), "danceability", "energy", "speechiness" (more on that later) that are ostensibly based on things like BPM, number and complexity of words in the song, and rhythm. It also shows how popular the song is on the platform as of December 2020.
Anyone who knows me in real life knows that music is one of my greatest passions. Specifically, the Hip Hop genre. So I put together a list of around 40 hip hop artists and did some summary analysis (and a bit of machine learning) to find a little bit about how they stacked up against each other. Now my library is a little eclectic, and the analysis was originally to look at who the "most lyrical" artists were, so I instead just assembled a list of popular artists from the 2000s and 2010s, with some early names sprinkled in. It's geared more towards "rappers/emcees", so a lot of popular names that I like (The Weeknd, Miguel, etc.) are excluded. There were some mysterious holes in the data with regards to some artists - most artists had complete or semi-complete discographies to analyze, but others were missing in the data -- notably Lupe Fiasco and Pusha T.
Who's Most Popular?
As I mentioned earlier, the data had popularity as of December 2020. As such, artist popularity had an obvious bias to newer artists with fresher music -- someone like Juice WRLD enjoys immense streaming popularity right now compared to someone like Jay-Z, even if Jay-Z is a more acclaimed artist and has sold more records overall. As a crude control for this, instead of taking the average track popularity, I took the 75th percentile -- which allows for artists with a large body of work like Jay-Z to somewhat "filter out" their older, less popular songs, and use their most recent, popular work as a metric of popularity. A chart with notable names shows that some artists have stood the test of time better than others.
Track Positivity
One of the other interesting metrics that Spotify measures and tracks is song "positivity". Spotify defines this variable as "a measure from 0.0 to 1.0 describing the musical positiveness conveyed by a track." A value of 1 is a perfectly positive song, while a value of 0 is a perfectly negative song. I assume they use some sort of natural language processing (NLP) on the lyrics to determine this. Rappers ranged the gamut on average positivity.
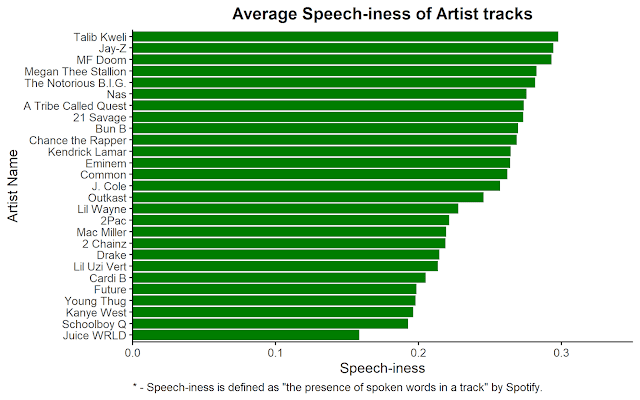
Speech-iness
And now, for the fun part. Can this dataset settle the debate which artists are "the most lyrical"? There is a variable called "speechiness", which Spotify defines as a variable that "detects the presence of spoken words in a track. The more exclusively speech-like the recording ... the closer to 1.0 the attribute value." So higher values indicate more "rapping", while lower values indicate more reliance on beats or instruments. So -- not exactly a measure of lyrical complexity, but it can still give us a sense. Let's take a look.
So, generally, these results make sense (absent a surprise or two). We'd expect people like Talib Kweli, MF Doom, and Nas to top the list. On the other hand, newer artists like Future and Lil Uzi Vert are lower down in the list, fitting what some people consider to be the current trend in hip hop. Juice WRLD, who is less of a "rapper" in the classical sense is in last place by a mile. Frankly, I did not expect Megan Thee Stallion to be that high. I don't listen to much of her music, so maybe she's more lyrical than I thought, or maybe the variable has its flaws. I also didn't expect 21 Savage to beat out Eminem or Kendrick.
Full Results
The full results of all variables for all artists can be found below:
What determines popularity?
Now that we have all these variables, one might naturally wonder if we can "figure out" popularity and see which variables are important in determining popularity. This is a machine learning problem. Now, there are a few different ways to determine which variables are "important." Arguably the best one is Lasso Regression (skip the next paragraph if you're not interested in a quick stats primer).
Do you remember your college stats class where you learned about Ordinary Least Squares (OLS, a.k.a. linear regression)? Don't get intimidated yet - OLS is really simple, you just use linear algebra (aka your computer) to minimize the residuals of the functional form you choose. Essentially you want to minimize:
\[\sum_{i=1}^{n}{y_i - \hat{y_i}}\] or
\[\sum_{i=1}^{n}{(y_i - \beta_0 - \sum_{j=1}^{p}{x_{ij}\beta_j})}\]
In this case, you hand-pick a vector of variables with coefficients \(\beta\) and solve. All the variables you pick will be in the model. However, Lasso Regression introduces a "penalty" in the above optimization problem that shrinks coefficients to zero, potentially eliminating the ones that are not "important" to the model. As such, you instead minimize:
\[\sum_{i=1}^{n}{(y_i - \beta_0 - \sum_{j=1}^{p}{x_{ij}\beta_j})} + \lambda\sum_{j=1}^{p}{\left|\beta_j\right|}\]
where \(\lambda\) is a cost constant picked through cross-validation. So essentially, you can throw all your variables into the model without having to self-select and the algorithm will shrink some of the coefficients to zero based on the cost constant, and will allow the "important ones" to be non-zero.
Here's what happened when I ran Lasso Regression on all the variables Spotify measured for the tracks recorded by my 40 or so hip hop artists: positivity, date released, "acousticness", "danceability", duration, explicitness, "instrumentalness", "speechiness", and "energy."

As we can see, the model threw out the "explicitness" and "acousticnesss" variables. Normally, you cannot compare regression coefficients to determine "variable importance." That's because different variables are measured on different scales. In order to compare coefficients, I standardized each variable such that they had means of 0 and standard deviations of 1. This means they are now measured on the same scale and can be compared, at the cost of the coefficients losing a little bit of their layman's meaning.
Here we see that by far, the most important variable was "date" - more current songs tended to be a lot more popular. Once that's controlled for, Loudness and Energy were the most important song features, in opposite directions -- louder songs were more popular, while more "energetic" songs (defined as a perceptual measure of intensity and activity -- death metal has high energy, while a Bach prelude scores low on the scale) are predicted to do more poorly. This is interesting because loudness and energy are highly correlated in the data (r = 0.68). Danceable and positive music were the next set of positive important variables, while overly speechy or instrumental songs had negative importance. The model suggests a longer song will be slightly less popular, all else held equal. I should remind the reader that this model was run on the subset of hip hop music recorded by my selected artists, so the results only apply to their music and can't be extrapolated to music in general (i.e. maybe country music values danceability differently).
Conclusion
For anyone familiar with the hip hop scene, I think this analysis shows that there's probably a little bit left to be desired from these variables -- converting art into measurable numbers is understandably difficult. But, overall, from what I could tell, Spotify seems to be doing a reasonably good job. But, popularity is an objective, measurable variable, and the model gave us some interesting results on what variables are important in determining that. Nobody cares about explicitness (edited tracks are the worst), so that makes sense. We like loud, danceable, positive music (RIP sadbois).
Thanks for reading, and I hope this gives you a much needed break from COVID posts.
Don't forget to subscribe to my emailing list so you can get an email when a new blogpost comes out!
Comments
Post a Comment